Climate Explorer

Home — Climate Explorer results: Effects of El Niño and La Niña on world weather

Climate Explorer results

Effects of El Niño and La Niña on world weather

El Niño and La Niña affect the weather in large parts of the world. The effects depend strongly on the location and the season. The strongest effects on precipitation are in South-East Asia and the western Pacifc Ocean, especially in the dry season (August-November). There are temperature effects throughout most of the tropics. The number of tropical cyclones also depends on El Niño in most basins. In boreal winter the effects are most wide-spread: from southern Africa to eastern Russia and most of the Americas.

For the four meteorological seasons we computed how El Niño and La Niña perturbed the average weather of the last century. We used the GPCC V7 analysis of monthly mean precipitation and the CRU TS 3.22 analysis of temperature.

Precipitation

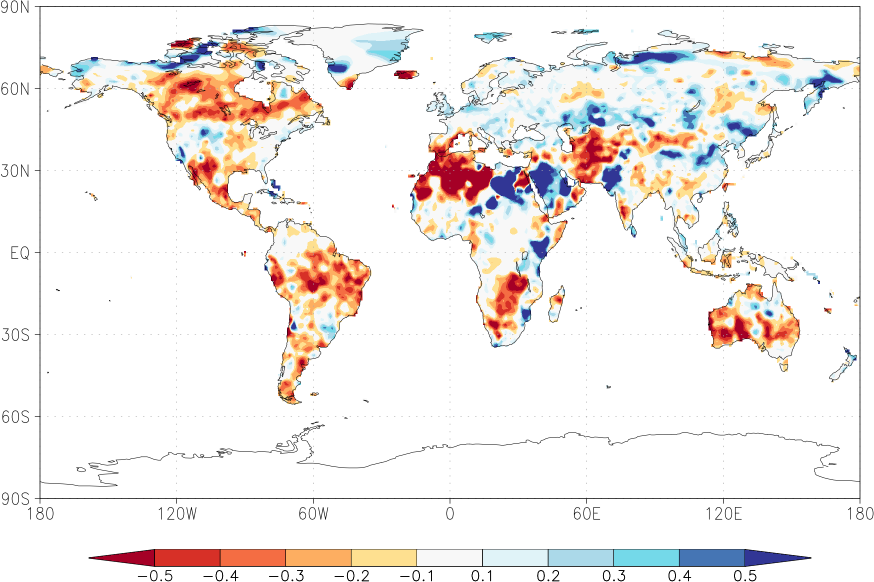
Blue colours indicate that during El Niño there was, on average, more rain than normal, red colours indicate drought during El Niño. La Niña has the opposite effect in almost all locations. As a measure of the strength of the relationship we used the correlation coefficient with the Niño3.4 index. The square of this number gives the fraction of the variance that is explained by this aspect of El Niño.
March-May In boreal spring the strongest effects are in the western Pacific Ocean: along the equator rainfall increases during El Niño and at 10°-15° North and South rainfall decreases. The north of Mexico and the desert states of the U.S. usually get more rain. The North-East of Brasil often stays drier than usual during El Niño. Even in our part of Europe it rains more on average during El Niño.
Relationship between El Niño and rainfall in March-May
June-August In these months eastern Indonesia often suffers droughts during El Niño. The rain zone has moved east to the islands along the equator in the Pacific Ocean. The Indian Monsoon is often weaker during El Niño, although by no means always.
Relationship between El Niño and rainfall in June-August
September-November This season the effects of El Niño are strongest. Almost all of Indonesia, the Philippines and eastern Australia are drier than usual during most El Niño events. Large parts of India are often drier than usual, but the Sri Lanka and some southern states get more rain. East Africa, parts of Central Asia and Spain are also on average wetter than normal during El Niño in this season, as are Chili and Uruguay.
Relationship between El Niño and rainfall in September-November
December-February In boreal winter the Philippines and East Indonesia stay drier, whereas the Pacific islands along the equator remain wetter. Florida also gets more rain than normal during El Niño, this effect extends to other southern states of the U.S. and into Mexico. South Africa is more frequently dry, as is the northern coast of South America and some of the leeward Antilles. In Uruguay en South Brasil rainfall increases on average. Along the coasts of Ecuador and Peru rainfall increases when the coastal waters heat up, an effect also named El Niño but not always coincident with the warming along the equator that affects the rest of the world.
Relationship between El Niño and rainfall in December-February

Temperature

In the temperature maps, red colours denote locations that on average are warmer during El Niño and cooler during La Niña. Blue colours are colder during El Niño and/or warmer during La Niña. Some North America effects are non-linear: the effect of La Niña is not the opposite of the effect of El Niño.
March-May In this season El Niño causes warmer weather in most of the tropics. The north-western coast of North America is also warmer than usual. In constrast, the south-east of the U.S. and north-eastern Mexico are often warmer during La Niña.
Relationship between El Niño and temperature in March-May
June-August The heat signal is very clear in India, West Africa and eastern South America. Summer in East-Asia and eastern Canada is often somewhat cooler than normal.
Relationship between El Niño and temperature in Jun-August
September-November The east coast of Central and South America, India and southern Australia are often warmer during El Niño.
Relationship between El Niño and temperature in September-November
December-February The effects of El Niño on temperature are clearest in boreal winter, when El Niño normally is strongest. Northern North and South America, Australia and also southern Africa usually have warmer weather than normal during El Niño.
Relationship between El Niño and temperature in December-February

Tropical Cyclones

During El Niño there are on average fewer hurricanes over the Atlantic Ocean, the Caribbian Sea and the Gulf of Mexico. La Niña often brings more. The west coast of Mexico and the United States see more landfalling hurricanes during El Niño. In the central Pacific Ocean El Niño brings more typhoons, both north and south of the equator. Their more easterly genesis makes that fewer of these tropical cyclones reach Australia. In the northern Pacific Ocean the area with typhoons also shifts east. Ther are no effects on the number of cyclones over the Indian Ocean.
Relationship between El Niño and the number of tropical stroms

Back to top